InnoLIMS® is suitable for research, product development, production, and self-monitoring in organizations of all sizes. Satisfied InnoLIMS® users can be found in companies and public research organizations of all sizes. InnoLIMS is based on a knowledge base of all measurements and all other information needed for a laboratory, a production facility, or a research unit. Any types of files can be saved in the electronic archives.
InnoLIMS® includes a warranty period. The maintenance contract ensures that the system is updated regularly and in problem situations help is always at hand. The system is developed constantly and customer-specific features can be tailored on request.
With InnoLIMS®, analysis orders can be handled smoothly from receiving the order to billing the customer. The ordered analyses are seen on work lists that show which attributes are to be measured from each sample.
Instrument interfaces send the results into the system straight from the instruments. The results can also be entered manually by sample or method. When all the measurements of an order are finished, an analysis report can be made automatically. An electronic signature can be printed on the analysis report. The results and analysis reports can be published in InnoLIMS Extranet.
InnoLIMS® is well suited for research institutions for both project-based work and continuous monitoring. Each research project can have its own goal. Files of any type can be saved in the electronic archives for a specific project, sample or research object.
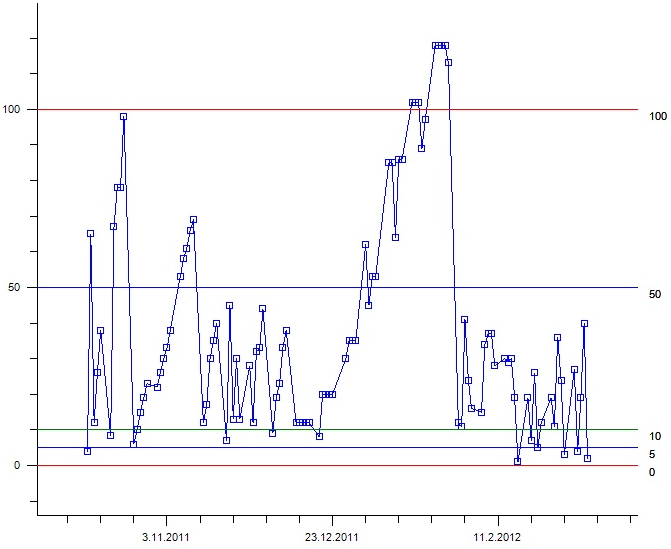
InnoLIMS® includes tools to make graphic representations of measured or observed attributes. Graphs can be printed from a time period to monitor the development of attributes with time, or as correlation graphs to see how different attributes correlate with one another. The results can be presented on different reports and tables.
InnoLIMS® can be used in production facilities for quality control, product development and reclamation handling. Samples can be registered to the system easily according to a sampling plan. Monitoring projects are made automatically for each week, month, or year, so that the results are always easy to find. Previous samples or analysis packages can be used as templates when registering process samples.
The analyses to be made are copied to the process sample from the template. Analyses can also be added or removed manually. The analyses are shown on work lists and sample queues. Results can be transferred straight from analysis instruments or entered manually. When a result is registered, InnoLIMS checks immediately if it is outside specifications and shows an alarm for outliers. Numerical and graphical monitoring reports can be printed from quality control information. Product descriptions can be printed for customers.
All interfaces have the ability to support different languages and terminology.
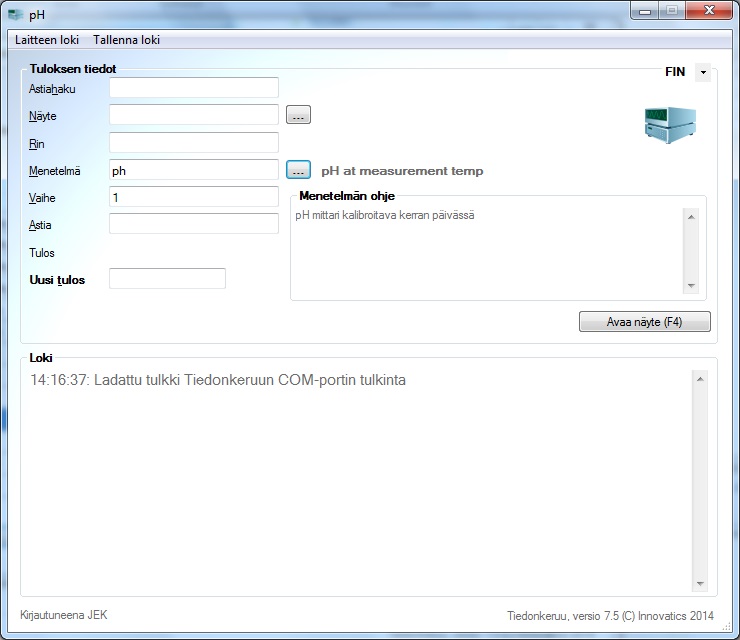
InnoLIMS® includes a module for online data gathering straight from the instrument. This speeds up the analysis process and reduces human errors. InnoLIMS can also be used to operate some instruments. Lists of unfinished analyses and sample queues can be printed by instrument. Interfaces can also be made to other programs and systems (e.g. financial, ERP and official systems). In addition to instrument and system-specific interfaces, data can be transferred smoothly with Excel or text files. This reduces the amount of manual work and helps transferring results without errors.
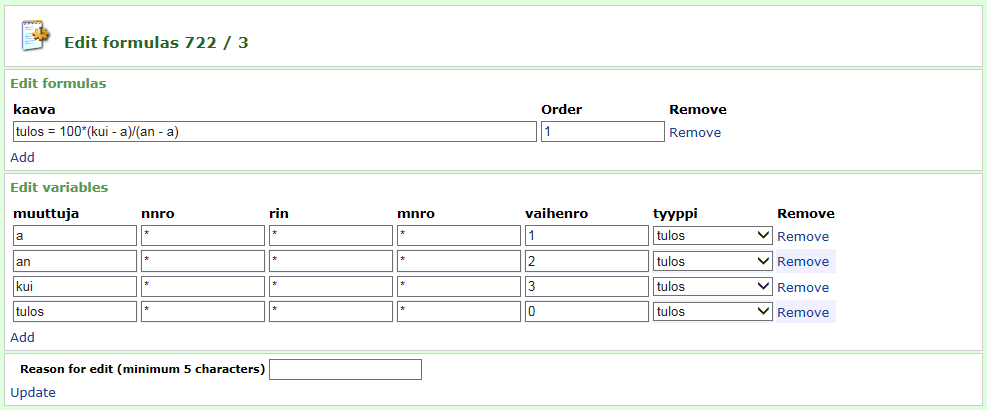
With the InnoLIMS® calculation tool InnoCalc, the system can calculate end results from measured values using user-defined calculation formulas, for example dry matter content from wet weight, container weight and dry weight, or a grain size distribution curve from a set of sieve analyses. Mean and standard deviation values are calculated automatically from parallel analyses. This reduces the need for manual registration, speeds up saving the results and reduces errors. Specifications for different attributes can be saved in InnoLIMS. The system will check if the result is outside the specifications immediately when registered or calculated.
InnoLIMS® includes a complete audit trail. All samples have a unique sample ID, which ensures that the results are saved for the right sample. Information saved in InnoLIMS® can be easily found even after many years. Each modification leaves a trace, which make sit easy to to discern the source and time of the modification. Deleted information can also be found from the history records.
The system includes approval tools for different levels of information. Approval of results can be done automatically or defined to be made by a technician or a manager. The same applies to samples, orders, and projects. The users are divided into user groups (roles) with different user permissions. Quality of measurement results is monitored with quality control samples (X charts, R charts...), calibration features and instrument maintenance. Different products and research objects can have their own defined quality specifications.
Information is easy to find in InnoLIMS® and results can be printed on different built-in reports. In addition to this, the users can run their own ad hoc searches with SQL and make their own ad hoc reports. The tools for these are "Own SQL Queries" and "Own Reports". For example, the Own Reports feature can be used to make a table of specified types of analyses for specified samples in a given timeframe. The user can format the report freely. The user can also define templates for sample labels with barcodes if needed.
InnoLIMS® makes it easy to keep track of work time used for different projects and orders. Measuring equipment can also have hourly use fees. Calculated work time and instrument use time can be used in billing and cost calculations.
Most basic information registers have an electronic archive for attachment files such as pictures or documents.